Simcenter Testing Solutions Simcenter Testlab Neo: TL Report and Data Queries – Tips and Tricks
2023-10-30T19:48:59.000-0400
Simcenter Testlab
Summary
TL Report and Data Queries are reporting and sharing concepts in Simcenter Testlab Neo. The following overview lists the benefits of the functionality for certain simple use cases from release version 2021.x till 2306.x on and will be updated as necessary with new releases.
Details
The Data Queries and TL Report are only available in Simcenter Desktop Neo and make Testlab Neo a powerful tool for organizing, visualizing, reporting and sharing findings, regardless of whether your measurements come from Testlab Classic or Testlab Neo.
Here is an overview of topics discussed in this article:
Starting from Preview, a Display can be duplicated into the current Report (Figure 1).
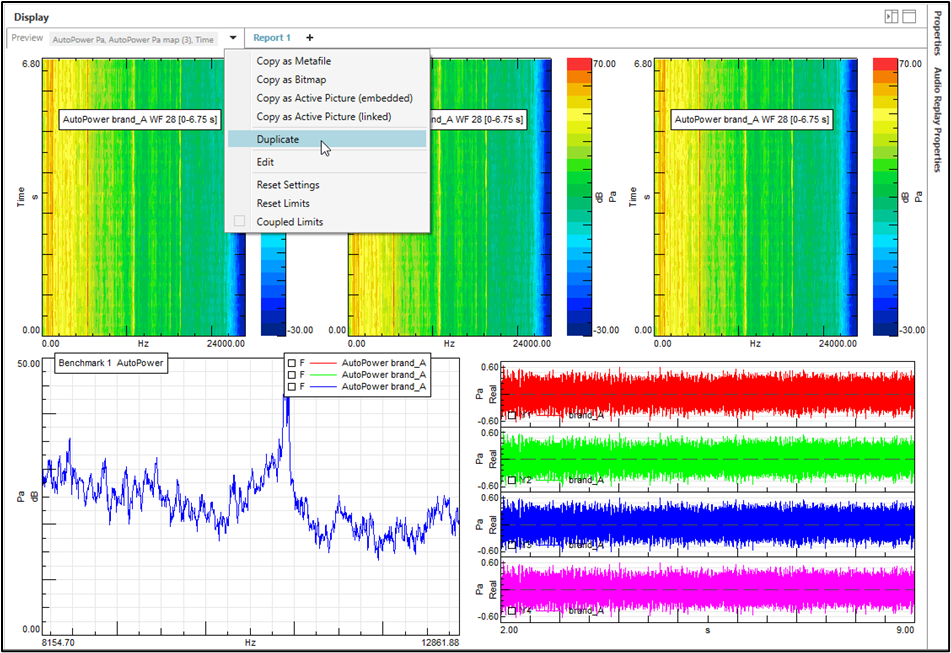
Figure 1: Example diagram arrangement
Here is an overview of topics discussed in this article:
- TL Report creation from Preview Picture Display
- TL Report creation from scratch
- TL Report creation with Data Queries
- Data Queries examples
- Some addition functions in the Data Queries window
- TL Report creation from Preview Picture Display
Starting from Preview, a Display can be duplicated into the current Report (Figure 1).
Figure 1: Example diagram arrangement
By clicking “Duplicate”, Desktop Neo copies the Preview layout into Report 1 (Figure 2).
Figure 2: Layout created from Preview Display
From release versions 2206.x and 2306.x, the “Duplicate” function is replaced by “Add to Report 1” as shown in Figure 2.1.
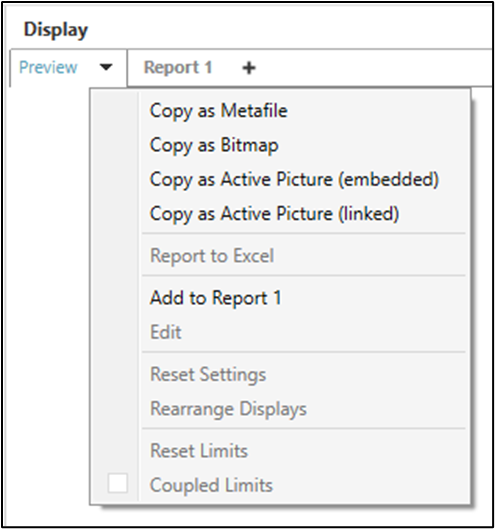
Figure 2.1: Preview Display Add to Report
It is possible to edit the layout by dragging new diagrams into the layout (Figure 3 left). Or just insert a new diagram if you want to add an additional layout to your Report (Figure 3 right).
Figure 2.1: Preview Display Add to Report
It is possible to edit the layout by dragging new diagrams into the layout (Figure 3 left). Or just insert a new diagram if you want to add an additional layout to your Report (Figure 3 right).
Figure 3: Edit the layout and / or add new ones
After inserting the data into the layout by drag and drop, the user can save the Report 1 (Figure 4).
Figure 4: Save Report as “TL Report_1”
The Report “TL Report_1” can be shared with other Simcenter Testlab Neo users as basis for further comparisons. The Report can also be modified at any time using the add, replace and remove functionality.
Testlab Neo saves the Reports in the user configuration folder under Layout - C:\Simcenter\UserConfiguration\”user”\Testlab 2021.x\Layout, or
C:\Simcenter\UserConfiguration\”user”\Testlab 2206.x\Layout, or
C:\Simcenter\UserConfiguration\”user”\Testlab 2306.x\Layout.
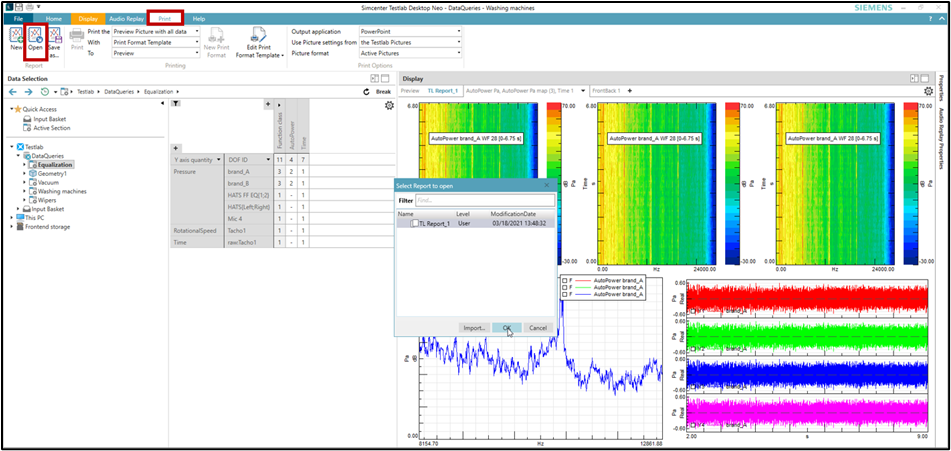
IMPORTANT NOTE: The following step is for Release Version 2021.x.
“TL Report_1” can be opened in the current Project using the “Open” button in the Print menu (Figure 5).
C:\Simcenter\UserConfiguration\”user”\Testlab 2206.x\Layout, or
C:\Simcenter\UserConfiguration\”user”\Testlab 2306.x\Layout.
IMPORTANT NOTE: The following step is for Release Version 2021.x.
“TL Report_1” can be opened in the current Project using the “Open” button in the Print menu (Figure 5).
Figure 5: Open “TL Report_1”
From release versions 2206.x and 2306.x you can find the “Open” Button in the Display menu.
Figure 5.1: Open “TL Report_1”
To print “TL Report_1” as a report in Power Point or Word, go to the Print menu, select the appropriate settings as shown in Figure 6, and click the Print button.
Figure 6: Print settings
An example of the report that would be generated is displayed below.
Figure 7: Report example in Power Point
Users who already have experience with Testlab can compare this new Report function in Neo with the "Print Format" function from Testlab Desktop.
Users who already have experience with Testlab can compare this new Report function in Neo with the "Print Format" function from Testlab Desktop.
2. TL Report creation from scratch
Without the Preview Picture Display, it is also possible to create a report. By clicking the “+” button right from Report 1 the user can create his own Report from scratch with several layouts and save as “TL Report_2” (Figure 8).
Figure 8: Report creation from scratch
When selecting in the Print menu the “Open” button, the “TL Report_2” can be opened for further investigation, adjustments and so on (Figure 9).
Figure 9: Open TL Report_2
As already mentioned, from release versions 2206.x and 2306.x you can find the “Open” Button in the Display menu.
3. TL Report creation with Data Queries
After creating your layout, switch to “Data as Queries” in the display menu (Figure 10).
Figure 10: Data as Queries
There are two indicators when a layout is populated with queries: A “Q” can be seen in the legend, or the word “query” will become visible as the data are dropped into the layout, as seen in Figure 11.
Figure 11: Query indicators
Save this report, as in Figure 4, with a new name, for instance – TL Report_Data-Queries (Figure 12).
Figure 12: Save Queries Report
4. Data Queries examples
By clicking the Display Queries button in the Display menu, Testlab Neo will open a new query summary window (Figure 13).
Figure 13: Data Queries window
Now it is possible to do fast changes in the diagrams by changing properties in the Data Queries window.
The following will show a few simple use cases.
- Switch the curve in the Frontback by changing the DOF-ID from brand_A to brand_B (Figure 14). After clicking the refresh button, the curve for brand_B appears.
- Add the brand_B curve addition to the brand_A curve in the Multitrace Diagram and press the Refresh Button! (Figure 15).
Figure 15: Multitrace Display example
- Change the Colormap Display by switching to another Run name and press the Refresh Button (Figure 16).
Figure 16: Colormap from different Run example
5. Some addition functions in the Data Queries window
Data Queries creates a list of all your settings (Figure 17).
It is possible to change the source of selected queries (Figure 18).
Add or remove properties (Figure 19).
Figure 19: Change properties list
By clicking the Add button you can insert additional properties. To remove a property, it is required to select the property field, in this example the Function Class, and then click the Remove button.
Summary:
A query is a request for data from a database or source, matching certain property values. It is a recipe to show certain data. Queries are only created when activated in the Display ribbon, when the selected node in the browse tree is a:
- Active project, section, run
- Passive project, section, run
- Active analysis
and only when the data is dropped from a Pivot view! List view is not supported!
If you have Questions, contact your local Support Engineer or open a ticket on the Simcenter Support Portal.
If you have Questions, contact your local Support Engineer or open a ticket on the Simcenter Support Portal.
Associated Components
Simcenter Testlab Digital Image Correlation
Testlab Environmental
Testlab Acoustics
Testlab Data Management
Testlab Desktop
Testlab Durability
Testlab General Acquisition
Testlab General Processing & Reporting
Testlab Rotating Machinery & Engine
Testlab Sound Designer
Testlab Structural Dynamics
Testlab Turbine