Octaves in Human Hearing
Summary
Details
- American National Standards Institute (ANSI) S.1.11: Specification for Octave, Half-Octave, and Third Octave Band Filter Sets
- International Electrotechnical Commission (IEC) 61260: Specifications for Octave-band and Fractional-Octave-band Filters
4. How Octaves Are Calculated
Octaves are calculated using a series of time-domain based, band-pass filters.
Time data is fed into a series of narrow-band filters as shown in Figure 7. Each filter band represents the frequency range of each octave. In Simcenter Testlab, the filter shapes conform to the ANSI and IEC standards.
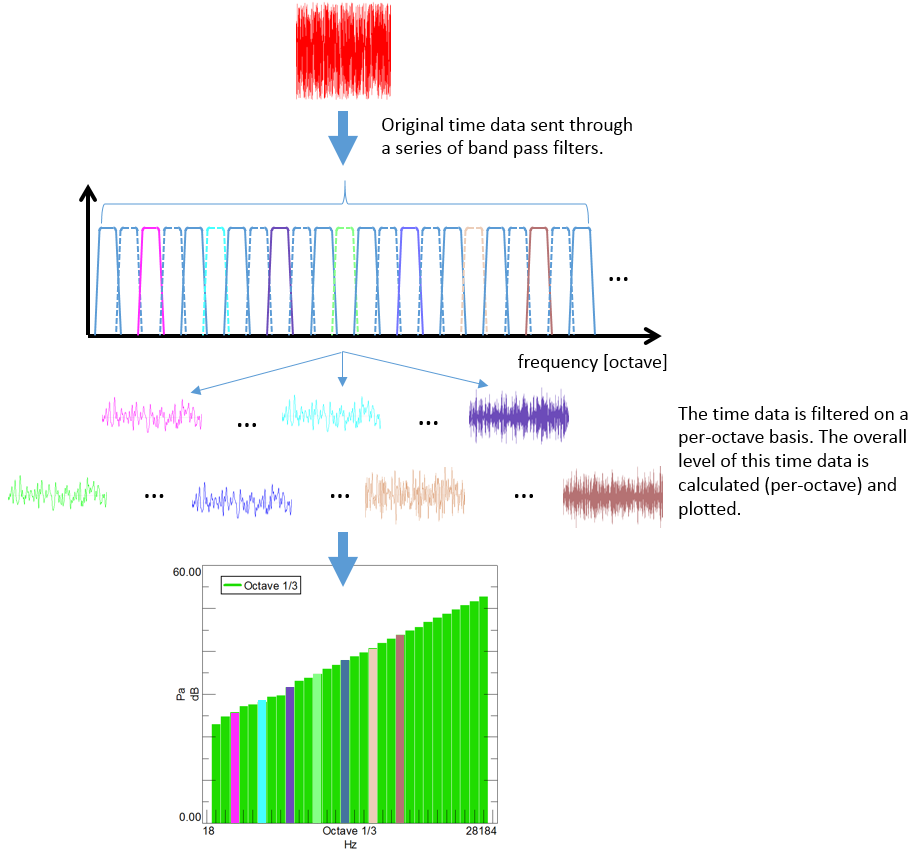
Figure 7: Time data is fed through narrow band filters. Each filter represents an octave band. The overall level of the time data is plotted on a per-octave basis and then plotted.
Both octave maps (like in the figure above) and octave sections can be calculated.
- Octave maps plot the octave bands vs. the overall level of energy in those bands.
- Octave sections track how a single octave band behaves against a tracking parameter.
For example, Figure 8 below shows how the 12.5 Hz, 20.0 Hz, and 25.0 Hz octave bands change with time.
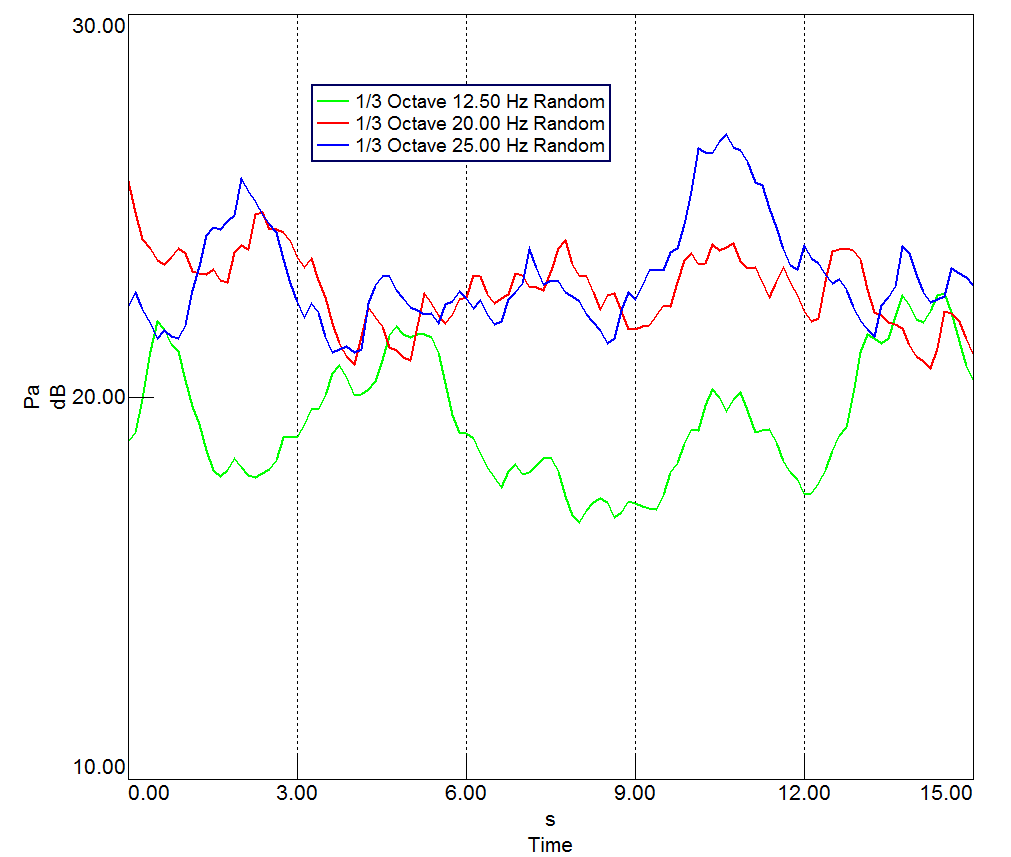
Figure 8: An octave section tracks how an octave behaves against a tracking parameter. In this case, it is tracking the octave against time.
Depending on the application, an average level of the octave may also be calculated, rather than displaying it against time.
5. Calculating Octaves in Simcenter Testlab
To calculate filter based octaves in Simcenter Testlab (formerly called LMS Test.Lab), go to “Tools -> Add-ins” and turn on “ANSI-IEC Octave Filtering” (Figure 9). This add-in requires 23 tokens.
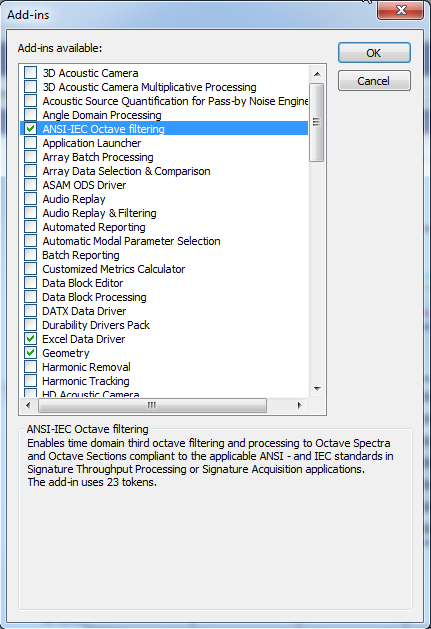
Figure 9: Turn on “ANSI-IEC Octave Filtering”.
In Time Data Processing, open the “Acquisition parameters” settings button (“Change Settings”) as shown in Figure 10.
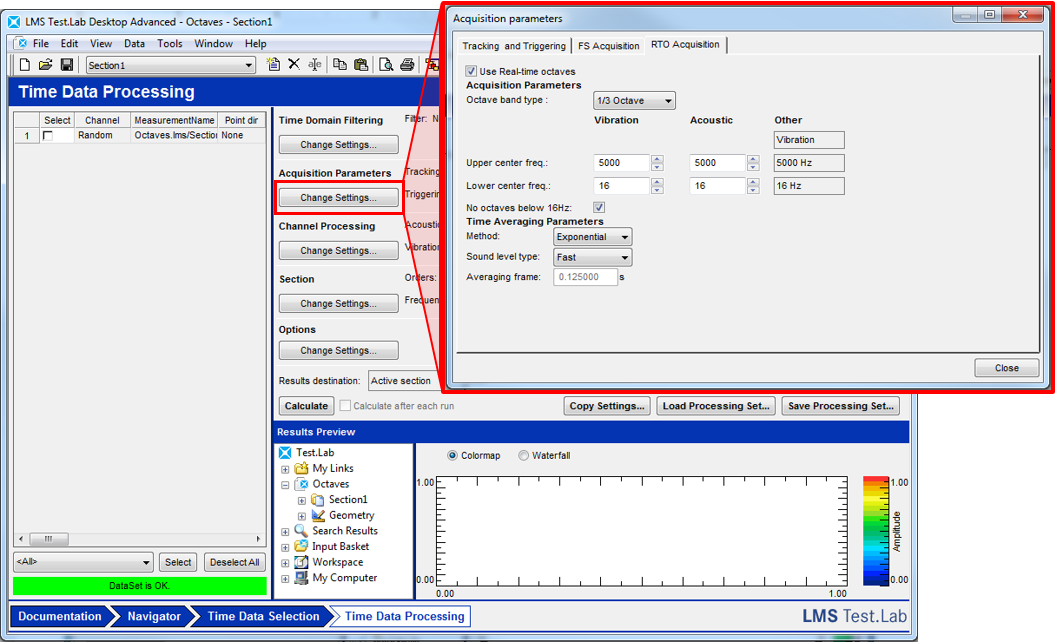
Figure 10: The change settings dialog for octave averaging.
Select an averaging method: exponential or linear. The exponential average weights the acquisitions taken later in time more heavily than earlier acquisitions. The linear average calculates the arithmetic mean of all the values.
Select a sound level type: fast (0.125 sec), slow (1.000 sec), impulse (0.035 sec), or user (custom). This parameter changes the length of the averaging frame. The averaging frame is the length of time that is used to calculate an average at every increment. Check out the Simcenter Testlab Throughput Processing Tips article for more information about increment and frames.
In Time Data Processing, open the “Section” settings button by clicking “Change Settings” under “Section. To calculate an octave map, go to the “Octave Maps” tab. Check on the octave band type that needs to be calculated as shown in Figure 11.
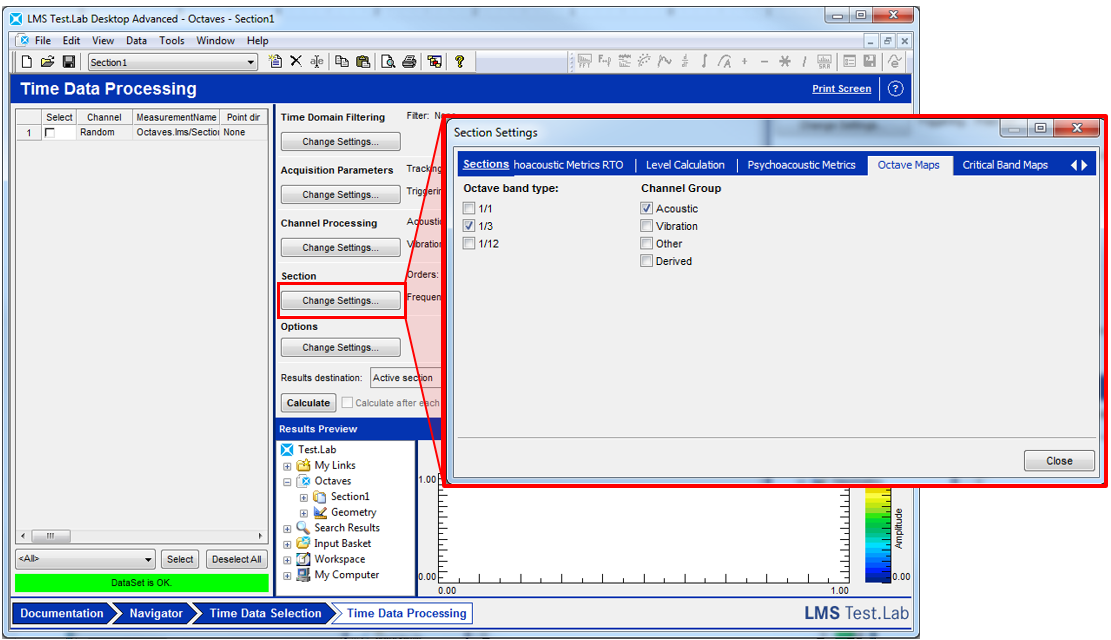
Figure 11: Calculating octave maps. In this case, 1/3 octaves will be calculated.
A result of this calculation would look something similar to Figure 12 below.
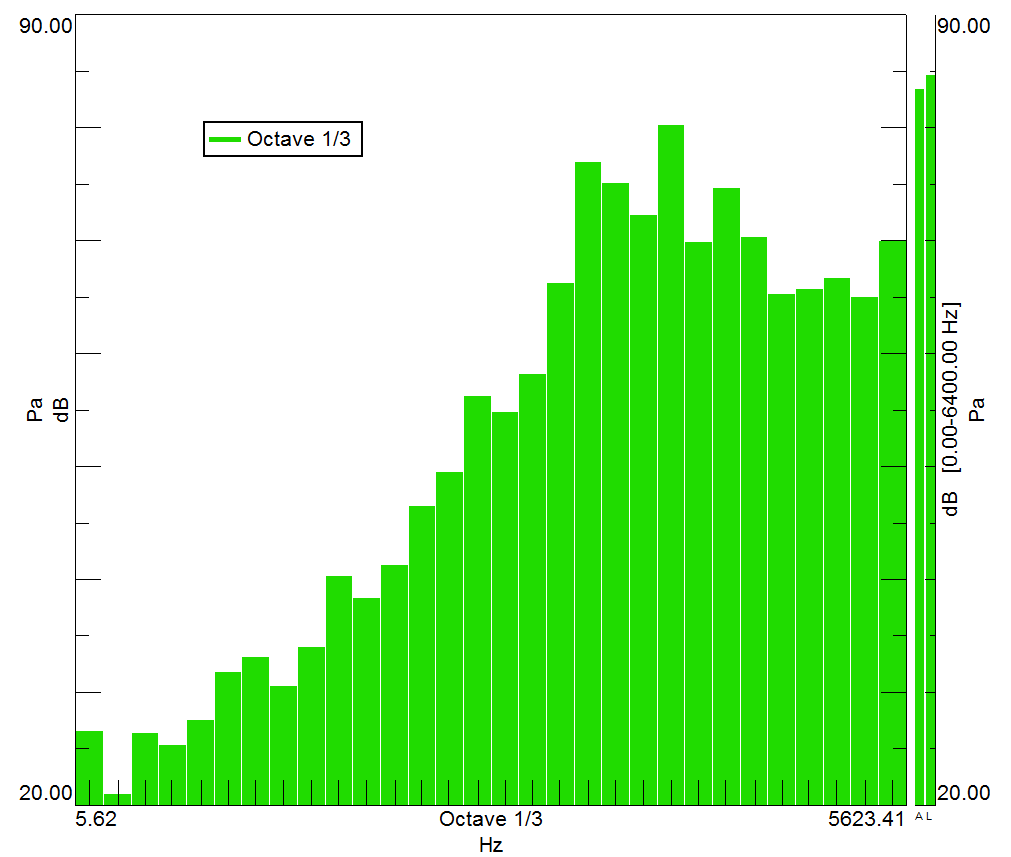
Figure 12: The result of an “octave map” calculation.
To calculate a single octave section, go to the “Octave Sections” tab. Type in the center frequency of the octave section(s) that is desired to be calculated as shown in Figure 13.
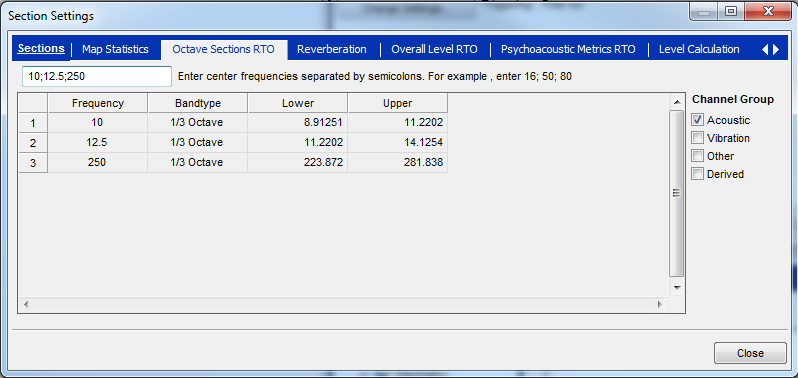
Figure 13: Octave sections to be calculated.
The octave section calculation will calculate how an octave behaves vs. a tracking parameter. Figure 14 below gives an example of the result from this calculation.
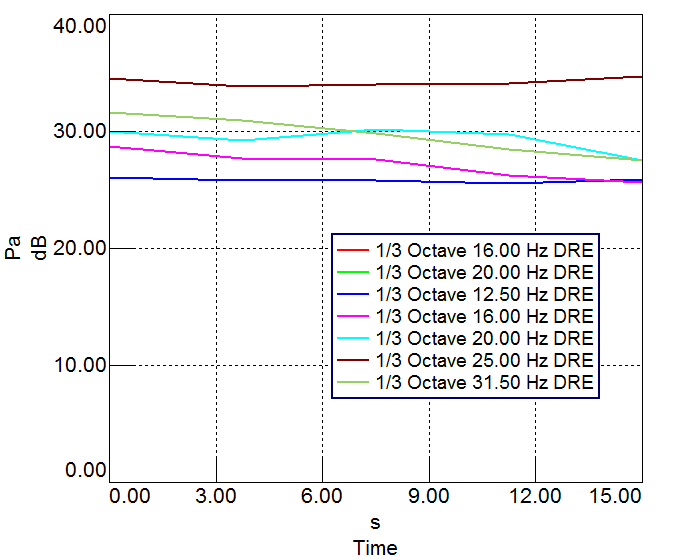
Figure 14: Example of how various octaves behave vs. time.
NOTE: There are a few additional tabs with the RTO (Real Time Octaves) suffix. Anything with the suffix RTO will used filter-based octaves to do processing. For example, “Psychoacoustic Metrics RTO” uses time-based filters to calculate sound metrics.
6. Octave Displays in Simcenter Testlab
Direct YouTube link: https://youtu.be/2FB1QOoPdeM
Octave data can be displayed using two different methods in Simcenter Testlab: the Octave Display and the FrontBack display:
6.1 Octave Display
There is a special display in Testlab called the “Octave Display". Data dropped into the display will always be shown in octaves.
The icon use to open the display is enlarged and shown in Figure 15 below.
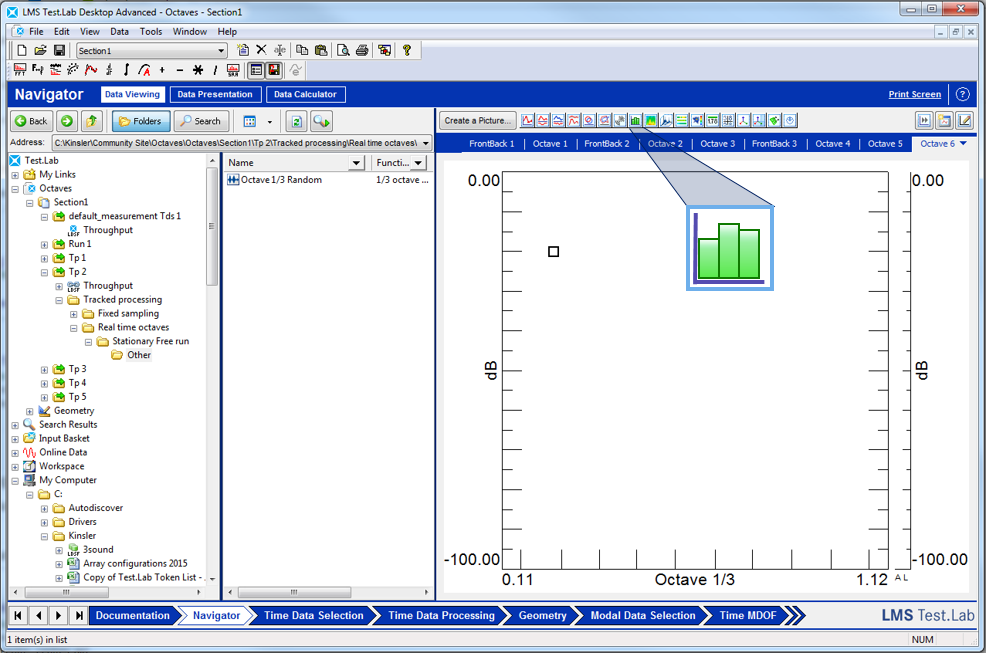
Figure 15: The octave display icon opens an octave display.
The octave display automatically puts the x-axis in octave format. It also automatically puts data into a “block display” format (as octaves are traditionally displayed in).
When data is dropped into an octave display, it will look similar to Figure 16 below:
Figure: 16: Octave Display
Even a narrowband spectrum will be converted to octave format when dropped in the display.
6.2 FrontBack Display
If data is already in octave format, the FrontBack display can be used to display it as shown in Figure 17:
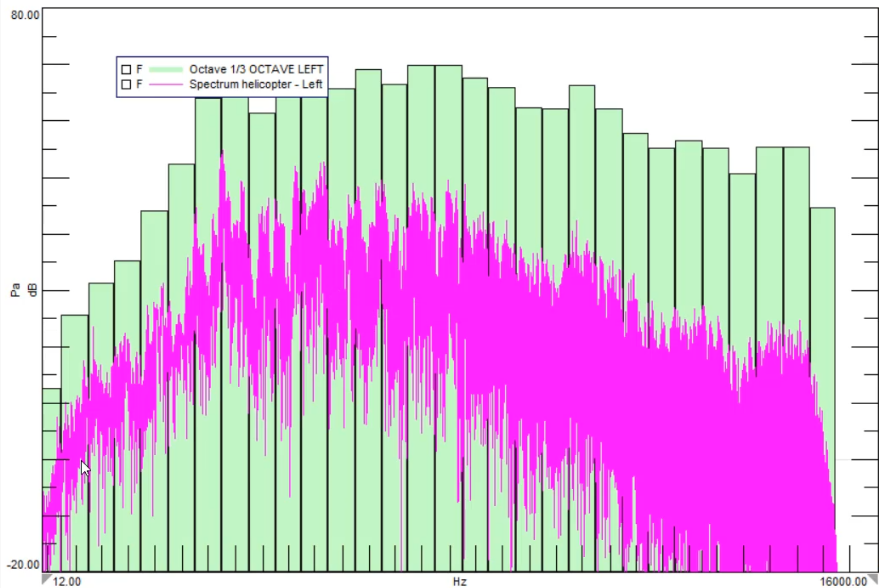
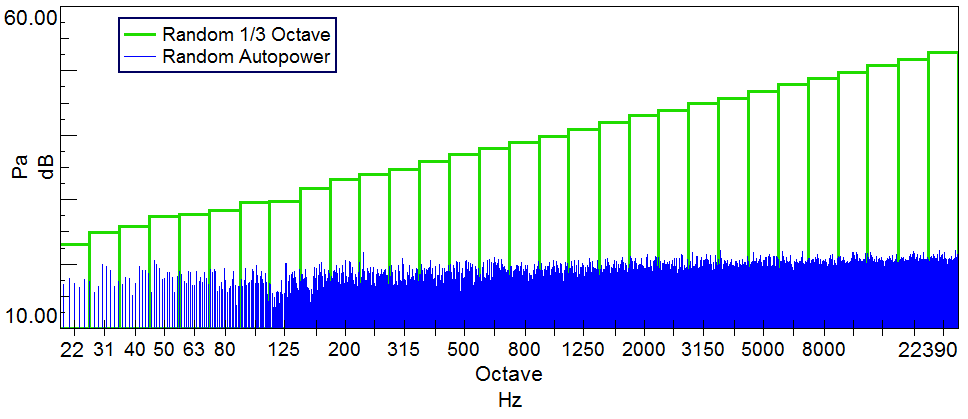
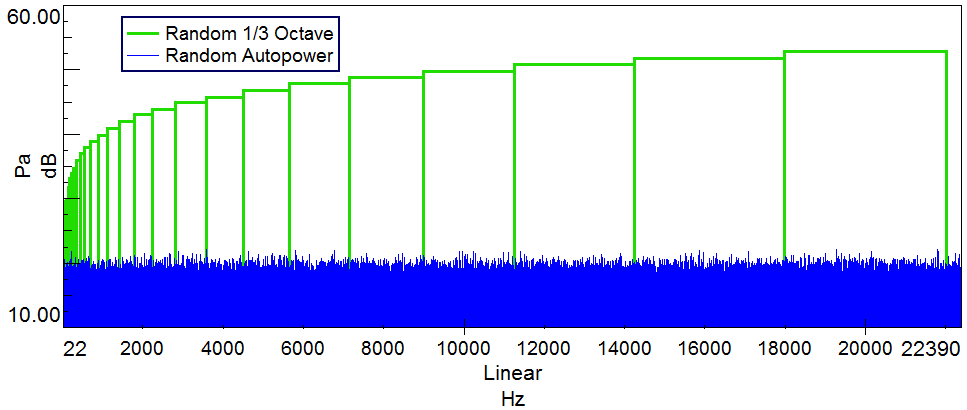
Figure 17: The FrontBack display can be used to display octaves and the corresponding narrowband spectrum overlaid.
To display octave data in the FrontBack display, here are some common settings:
- Y-Axis in dB: Right click on Y-axis and change format to dB.
- X-Axis in Octave: Right click on X-axis and change format to octave.
- Curve Style: Right click on data and choose "Curve Style...". Set Trace Style to "Blocks" or "Block Outlines". Change the "Outline color" if desired.
With the FrontBack display, both narrowband and octave data can be overlaid. This can yield useful insights. For example, the exact frequency of a tone that is causing an octave band to be higher than the rest can be identified.
Questions? Email Scott MacDonald (macdonald@siemens.com), contact Siemens Support Center, or reply to this article.
Related Links:
- Index of Testing Knowledge Articles
- History of Acoustics
- Microphone Basics
- Sound Pressure
- What is a decibel?
- What is A-weighting?
- Octaves and Human Hearing
- What is Sound Power?
- Decibel Math
- What is the Acoustic Quantity called Q?
- Sound Absorption
- Sound Transmission Loss
- Noise level certification, how to select the right standard?
- Sound pressure, sound power, and sound intensity: What is the difference?
- Sound fields: Free and diffuse field, near and far field
- Loudness and Sones
- Auditory Masking
- Tonality
- Tone-to-Noise Ratio and Prominence Ratio
- Fluctuation Strength and Roughness
- Simcenter Testlab Neo: Modulation Metrics
- Sharpness in Simcenter Testlab
- Critical Bands in Human Hearing
- Kurtosis
- Sound Quality Jury Testing
- NVH Testing and Data Acquisition
- Fundamentals of Sound Seminar - Part I
- Fundamentals of Sound Seminar - Part II
- Acoustic Testing YouTube Playlist
